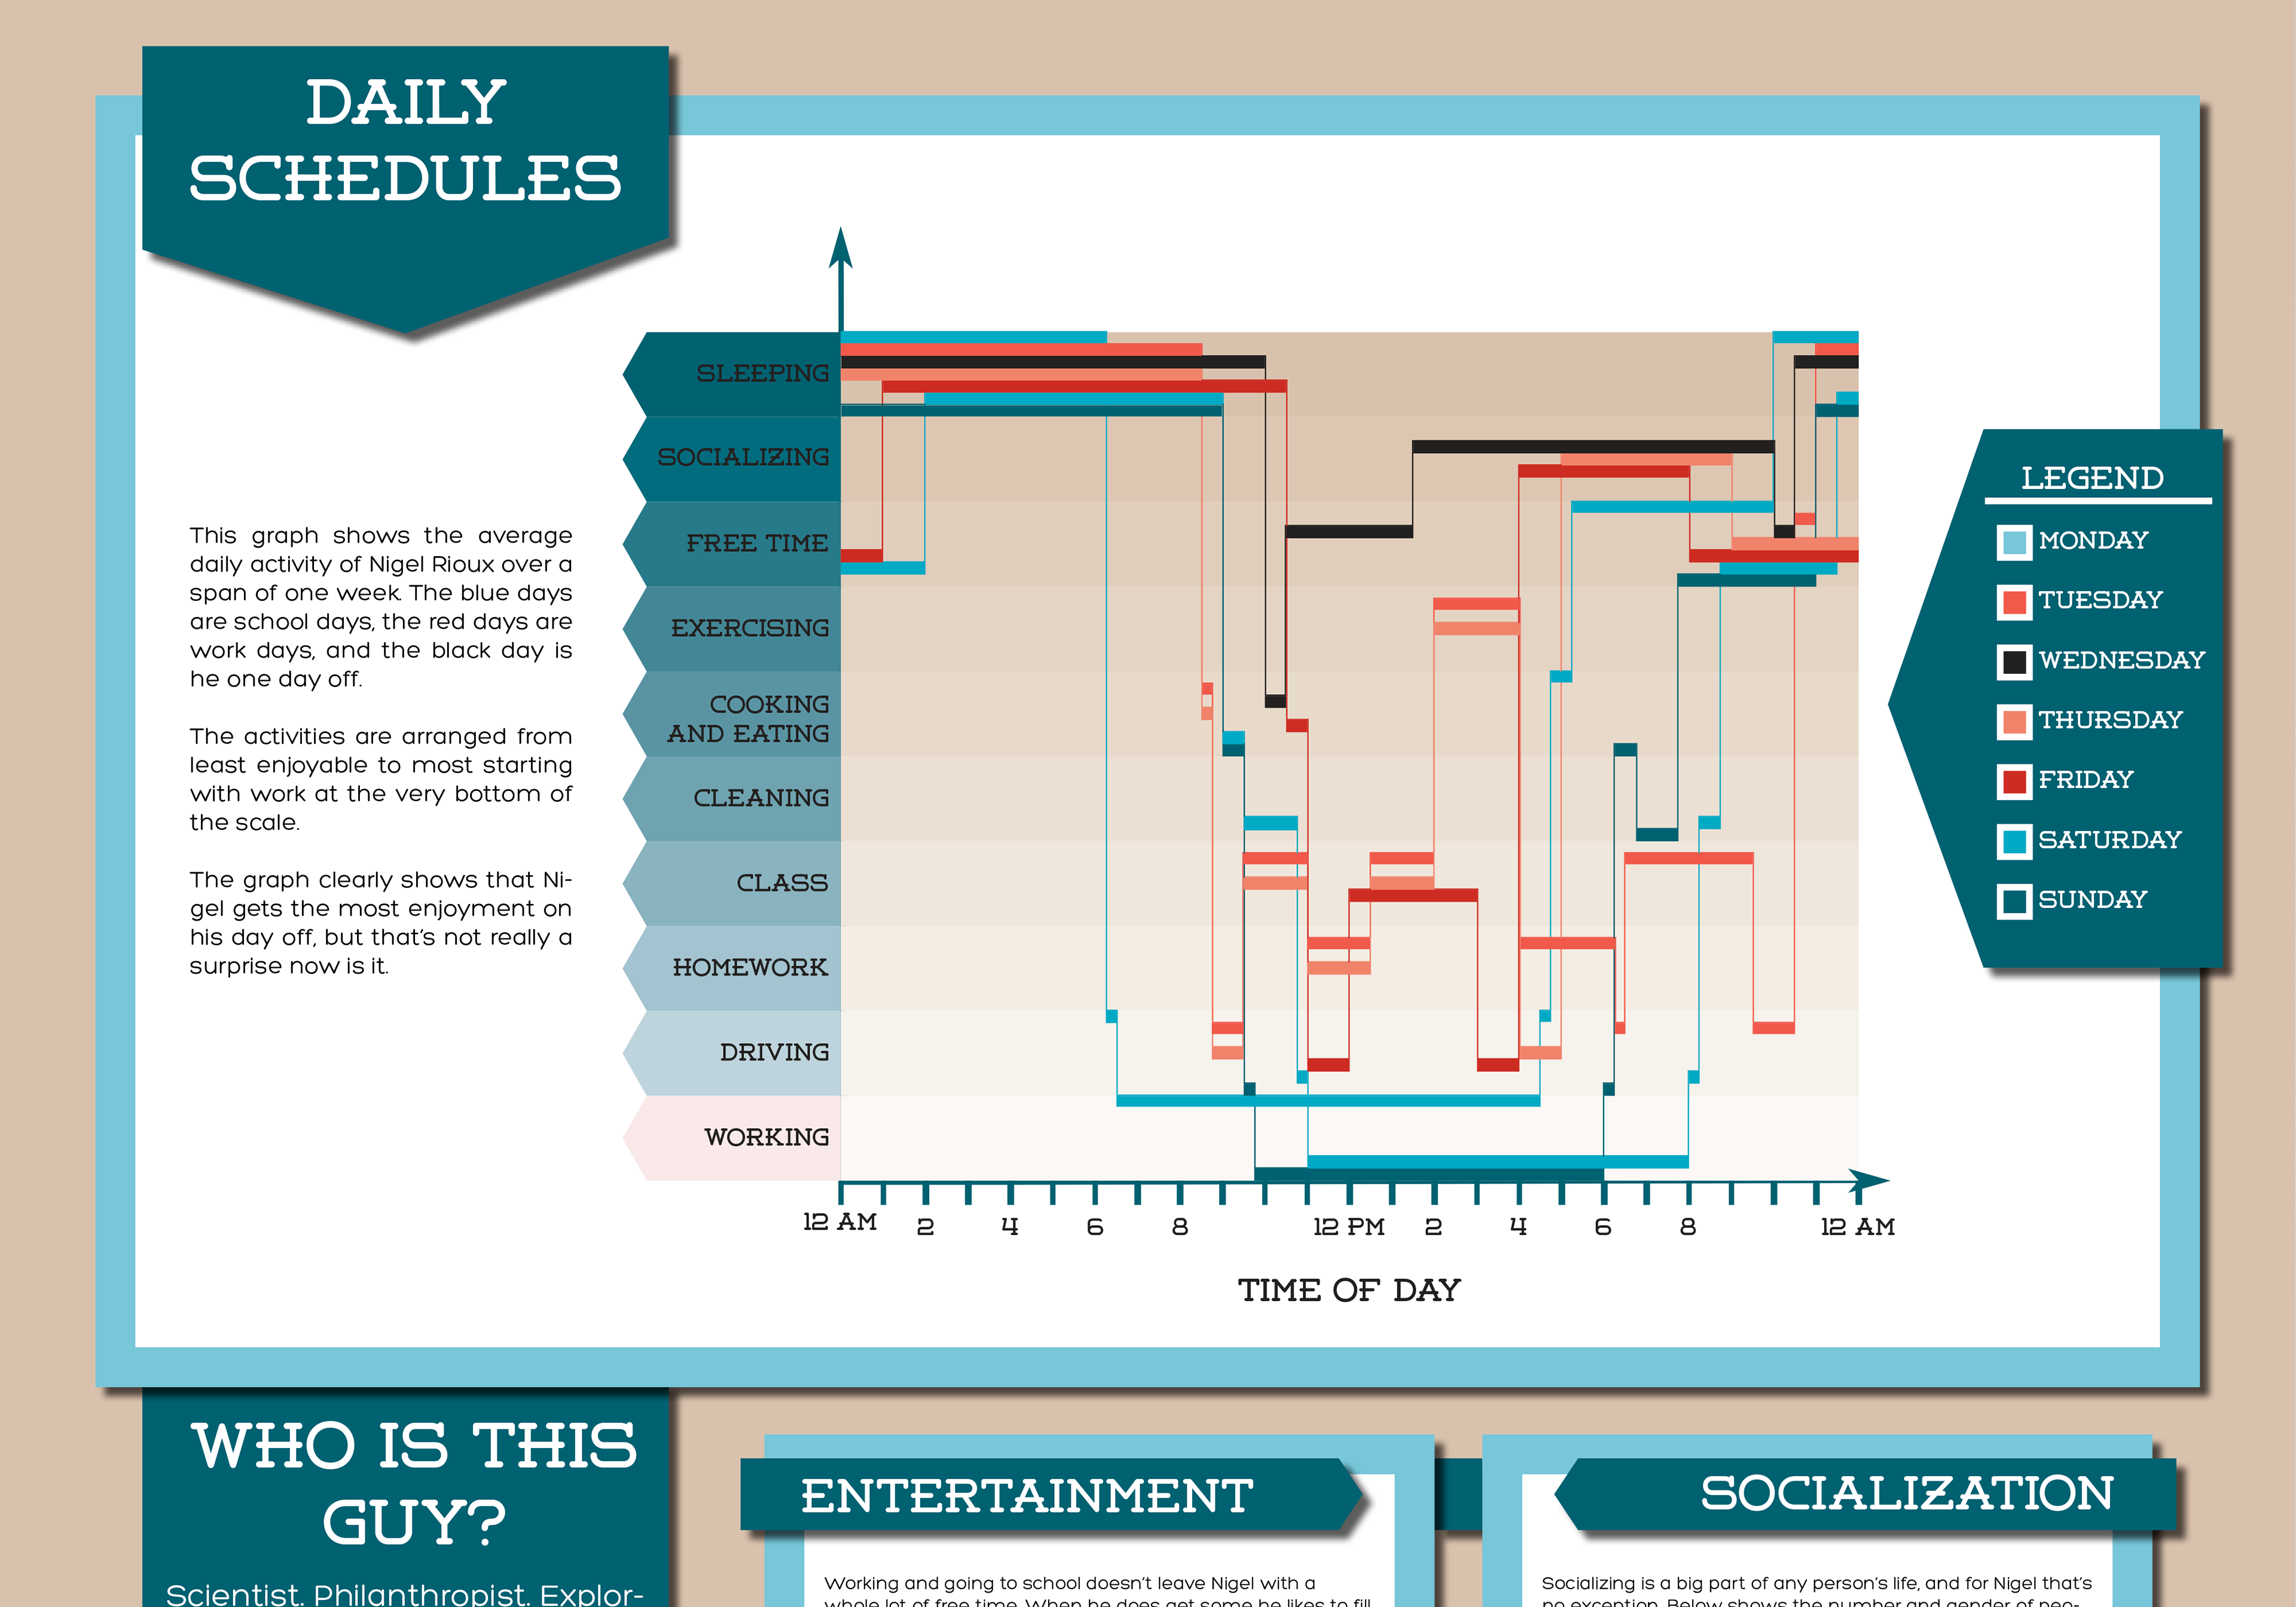
This project was an exercise in data visualization. The objective was to try and convey as much as we could about a person of our choice. My focus was on a friend of mine, who was currently juggling going to school, working, and maintaining a very healthy social life. He had achieved a nice balance by devoting each day to a specific focus. The main graph is colour coded to represent work days, school, days, and free days and tracks out the activities that typically happen on each. The activities are also arrange from least enjoyable to most, so you get an impression of how his mood might change during the week.